| |
GDP TYPE COMPARE to 2009
that affect US Industry
| GDP TYPE COMPARE to 2009
Sources: BEA (US Bureau of Analysis) FORWARD This report
compares the major types of items that make up GDP - as defined by the
US statistic group BEA (US Bureau if Analysis). These major items
are Durable Goods, Nondurable Goods, Services, and Structures. And
since we use pie charts, it of course means we are purposely comparing
percentages of the total rather than the subtotals themselves. SUMMARY
The largest issues that are obvious to me is that in comparing 3 years,
1929, 1950 and 1980 to 2009, it is clear that in each case goods are
dropping and service is increasing. One surprise perhaps is that
if we compared 1929 to 1950 the US actually had more services percentage
wise in 1929 and fewer goods than in 1950. This of course could be
due to WW2 and the technical knowledge gained around 1950 with
automobiles, airplanes, and even electronics - or at least that would be
my guess, while 1929 the industrial revolution had just gotten started.
Now in 1980, services were already high and goods lower, which was a
surprise to me. But if we compare the biggest change of these 3
items, 1950 to 2009, the drop in goods and the increase in service is
quite huge. View other data or data source links by returning to the
main data index page HERE. |
|
|
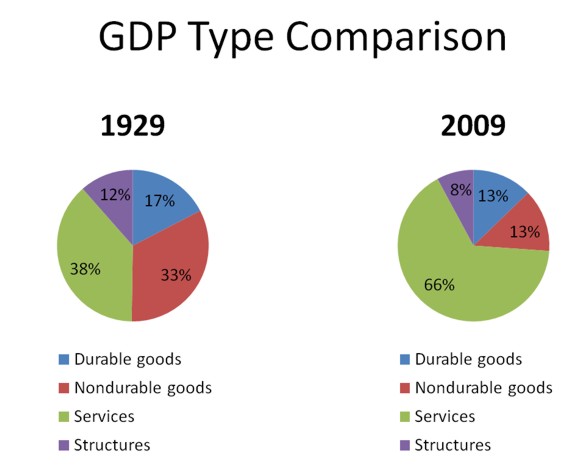
Comparing GDP data in 1929 to 2009 shows goods dropping from
50% of GDP to 26%, almost a drop in half
Comparing GDP services in 1929 to 2009 shows a growth from
38% to 66% a 42% increase in Service
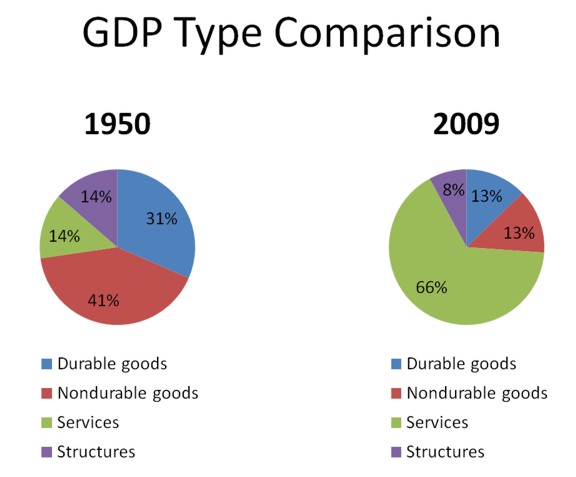
Comparing GDP data in 1950 to 2009 shows goods dropping from
72% of GDP to 26%, a 63% fall
Comparing GDP services in 1950 to 2009 shows a growth from
14% to 66% a 371% increase in Service
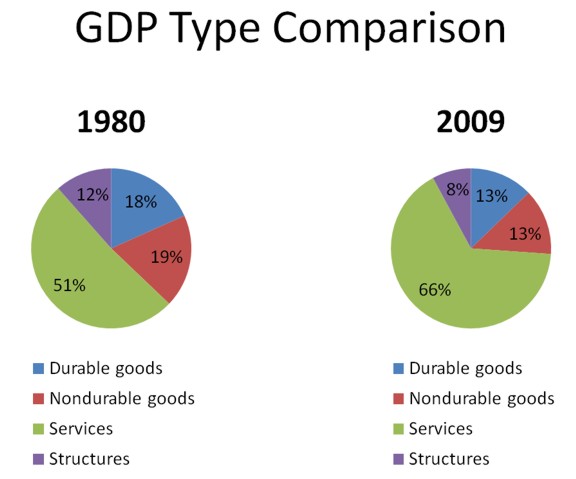
Comparing GDP data in 1980 to 2009 shows goods dropping from
37% of GDP to 26%, almost a 30% fall
Comparing GDP services in 1980 to 2009 shows a growth from
51% to 66% about a 30% increase in Service
|
|