 |
rpsoft 2000 TAXES, IRS, and LAFFER CURVES Graphs, Charts From USA Data |
|
The Laffer Curves
The US is in deep financial crisis. While the US has been adding debt now for at least 10 years, the last few years that debt has gotten to about $1.5 trillion per year. This figure is so high not only cannot we pay for it, we cannot even get loans for it. The highest holder of US debt at this time is China who holds about $870 billion of US debt, with Japan close behind at about $840 billion. But you can quickly see that our current debt rate is so high, it is now too high for even those holding US debt. This leaves the US only with bad choices - print money and create high inflation which will make the US dollar even less valuable, or they can sell off assets like the state of Hawaii for example. Hopefully many will agree that we need a new alternative - that of fixing the problem.
With the Bush tax cuts about to expire there is a good question of whether or not we should extend tax cuts for the rich. Some say we need to do this extension in order to get out of the recession. Some say it will cost an added $700 billion. Who is right? Well, one item that should be looked at are the Laffer Curves - started by Arthur Laffer. One is shown below:
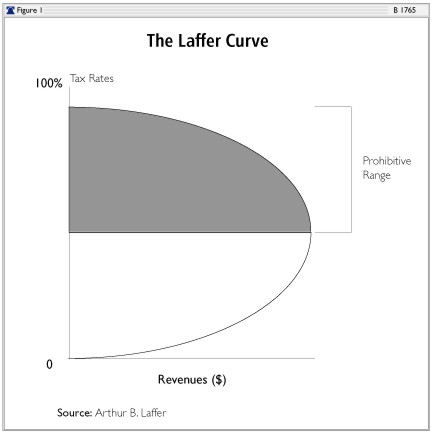
What this curve is about, is that the basic idea is to increase IRS revenues - and not necessarily taxes. The graph shows that at 0% taxes that there is no IRS revenue. But also at 100%, there also is no IRS revenue since no one (unless force is used) is going to work for free. So somewhere in the middle there is the spot where IRS revenues can be maximized. If US taxes were low and IRS taxes were raised in the US but still lower than other countries, well then IRS income would pick up. But if the taxes get too high - higher for example than taxes in other countries - then people might stop investing in the US and outsource business and jobs elsewhere, and that would in fact drop IRS revenue after taxes were raised. Please do not try to read exact numbers in the middle from this chart, since I am clear that that detail is not known, not even by Arthur Laffer. But at a low point increasing taxes will bring in more IRS revenue, but at higher points entrepreneurs will decrease business in the US, or hire better tax nerds, or just move themselves and their jobs out of the US as Bill Gates has said he might do. How do I know the basic idea that there is a point of no return is true? As Laffer states? Well, the Bush tax cuts are a matter of public record at this point and can be found from the US BEA (Bureau of Economic Analysis). Recall that some say that if tax cuts are given to the rich it would cost the US some $700 billion, although I am not clear over what period of time they are talking. But what did happen and was part of official public record? See the graph below from official US BEA records - after lowering taxes on the rich, IRS income ROSE by $1 trillion dollars - a $1.7 trillion dollar error on those who say it would cost $700 billion instead.
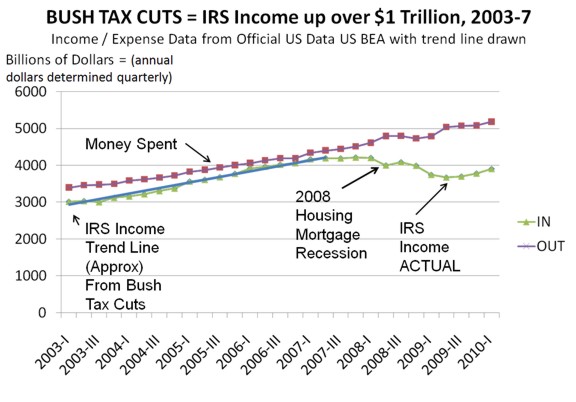
Unfortunately, the good news of the Bush tax cuts stops in 2008 with the housing mortgage recession. Had this not happened, and no new industry regulations in place, there is little doubt in my mind that $2 trillion of the $3 trillion debt the US had over the last two years would have gone away. As to the cause of the housing/mortgage recession, I still have not seen a good investigation. Since government controlled Fannie Mae and Freddie Mac were deep into the housing/mortgage business it is not clear, at least to me, the breakdown in liability between government and industry on that recession.
SUMMARY OF LAFFER CURVES
So then, just looking at the above two graphs, we can see that the Laffer curves indeed have merit. It is a matter of public US record that taxes were reduced from 2003 to 2007 and yet IRS income went up. This is something predicted at least as being possible by the Laffer curves. So the Laffer curves have validity, even if we are not sure of the exact threshold points there. But the other thing that we also know for sure, if we are being fair, is that tax rates were too high in 2001 for the best economy or for IRS income both. If taxes were reduced and IRS income went up, then high taxes were slowing industry, and hence employment and hence IRS taxes. So - in 2001 the US was already too high in tax percentages - and in fact was not only slowing industry, but also its own IRS income.