| |
PROFIT Data, US, 1969-1990
that affect US Industry
| US PROFIT Data from 1969 - 1990
Sources: US Department of Commerce, US BEA (US Bureau of Analysis) for Income, Expense and
Profit, DocStoc.com for Unemployment. For references, see the
right side of HERE. FORWARD, PLEASE READ
FIRST: It took me a long while to find good data out of the US.
I had thought for quite some time that most of television commentators
and experts were being free with their comments and not analyzing data
much. After getting into this, I find it makes me humble. As
hard as it is to find the data, it is far harder to analyze it. At
first I thought if profit was down, you could blame the president or
those in Congress. But after a bit, one realizes that there is far
more going on. Some presidents have "peace in their time".
Some fight recessions, and maybe more than one (Bush had 3) and some had
to deal with wars and some had to deal with tragedies of nature such as
volcanoes, hurricanes and floods and more. So a good analysis must
take that all into account. I did at least a second and then a
third level type
analysis on the 1990 -2010 items since I am more familiar with
recessions and wars in that period. I have not yet looked closely
at this period. I have heard that Reagan, who is one of my
favorite presidents, was faced with a giant recession and that he did a
good recovery. Well, one of us, perhaps me, should get deeper into
this period with analysis before casing stones. I thought I would
just present the data with also the cautions: - recessions, wars, acts
of nature can affect what you see even more than the politicians
involved. View the below data, or
skip ahead to another page for: profit
-1990-2010 or profit 1947-1969 or
profit 1929-2010 |
|
|
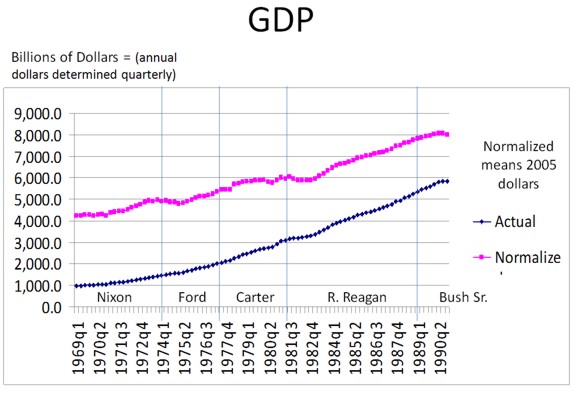
Mostly up which is good. It does seem somewhat stalled during the
Carter years and the early part of the Ford years and Reagan years, but that
the later Reagan years showed good growth. Reagan fans who are also
commentators do often say that he was faced with a recession and did well
fixing it.
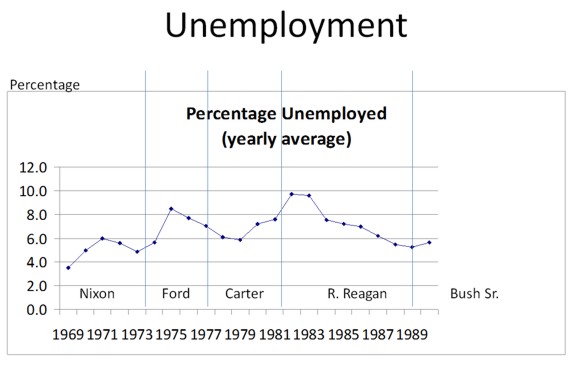
Bounces around a bit ... but it does go up at the end of Carter and
beginning of Reagan years, but then later in Reagan years goes down well.
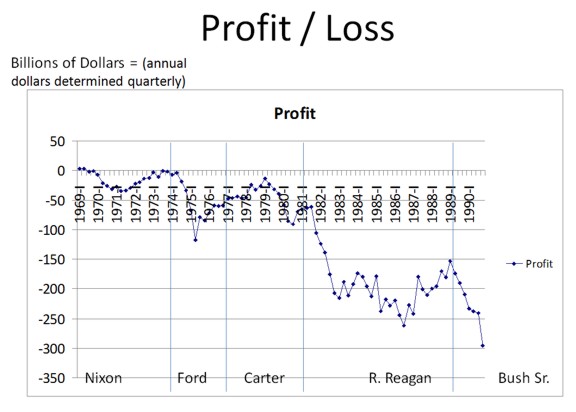
This profit graph of course is mostly just income (IRS
mostly) minus expense. Ouch. A downward trend in the whole era
and there is an indicator of a recession in about 1981, 1982 or so that
would take some analysis. But on the surface, it is not clear to me
that Reagan did well with debt.
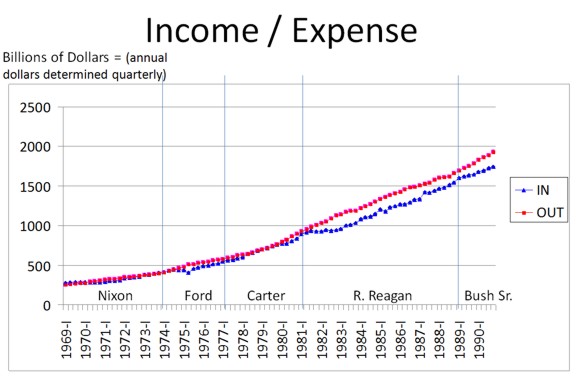
This graph does show where the profit and loss came from. It is not so
very clear here that the problem in the later years was too much spending -
but appears more to do with damage to industry near the Carter / Reagan
transition that did not get fixed fast enough. note that the real
issue in that period seems to be that income dropped, and not necessarily
that expenses went up.
|
|